League of Legends Player Stats in ReactJS and D3
Purpose: Personal Project
Project Type: R, ReactJS, D3
Date: Summer, 2020
A rewrite of the previous LoL Stats project written in R and Shiny R to instead use R, ReactJS and D3.
This was the first time using R to process data on a server as an API to then pass data to a React front-end to visualize the data with D3. Similar R code to the school project of visualizing LoL player data using R and Shiny R was used.
Basic Statistics
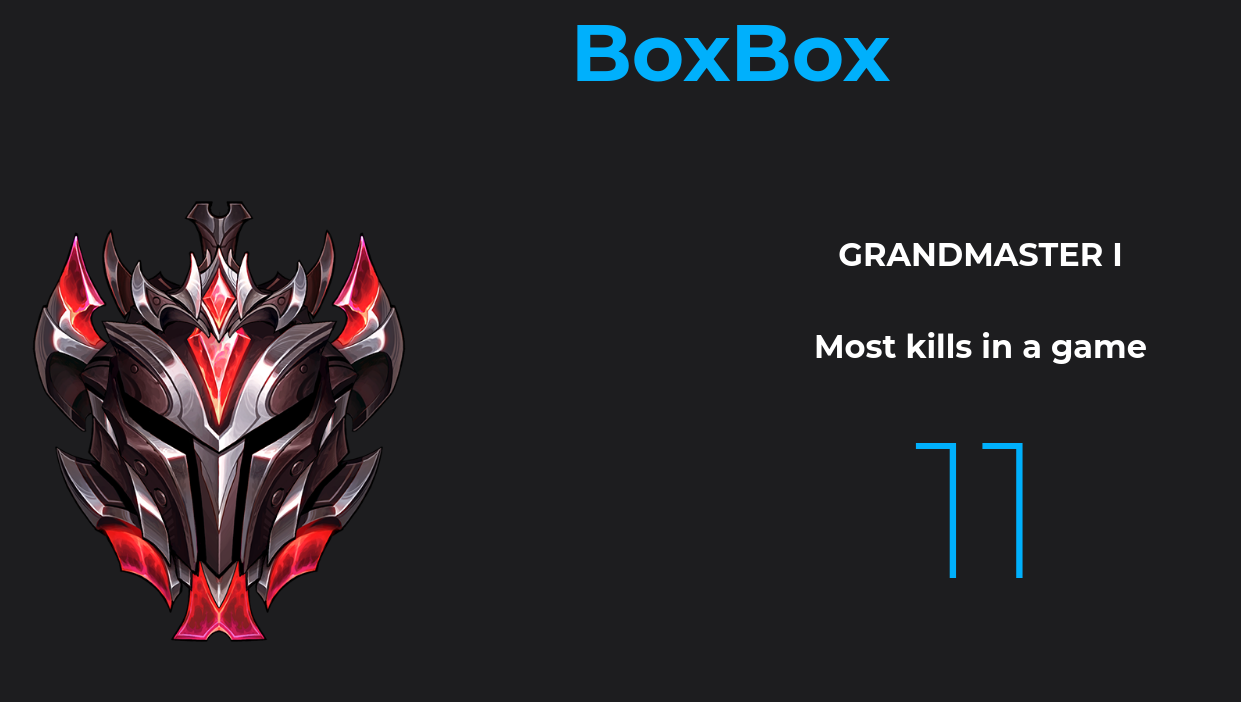
This basic section scrolls through some one-off statistics such as the highest damage dealt in a single game, or highest killstreak achieved.
Recently Played Champions
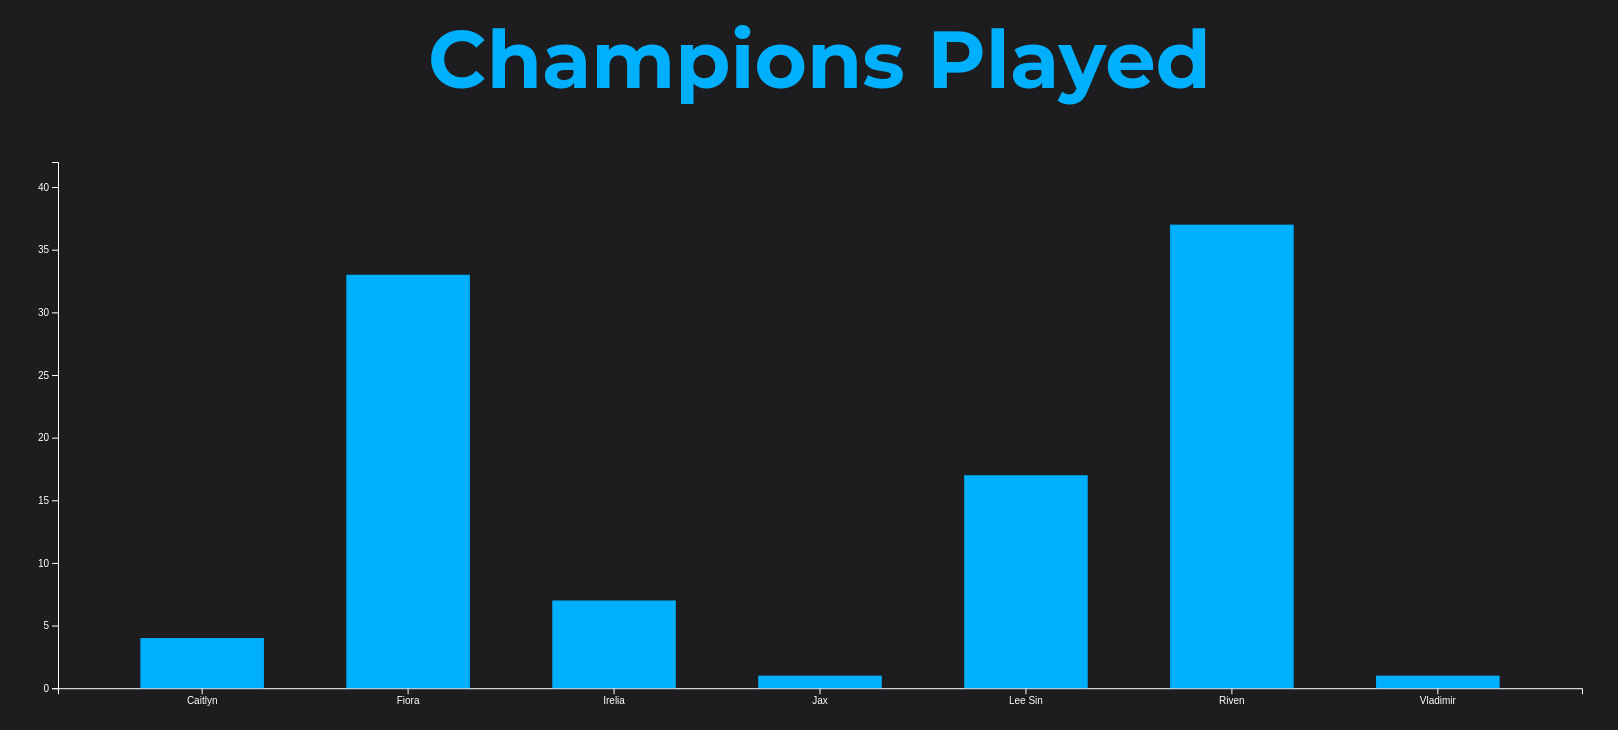
A frequency chart of the player's played champions in their last 100 games.
Time of Games
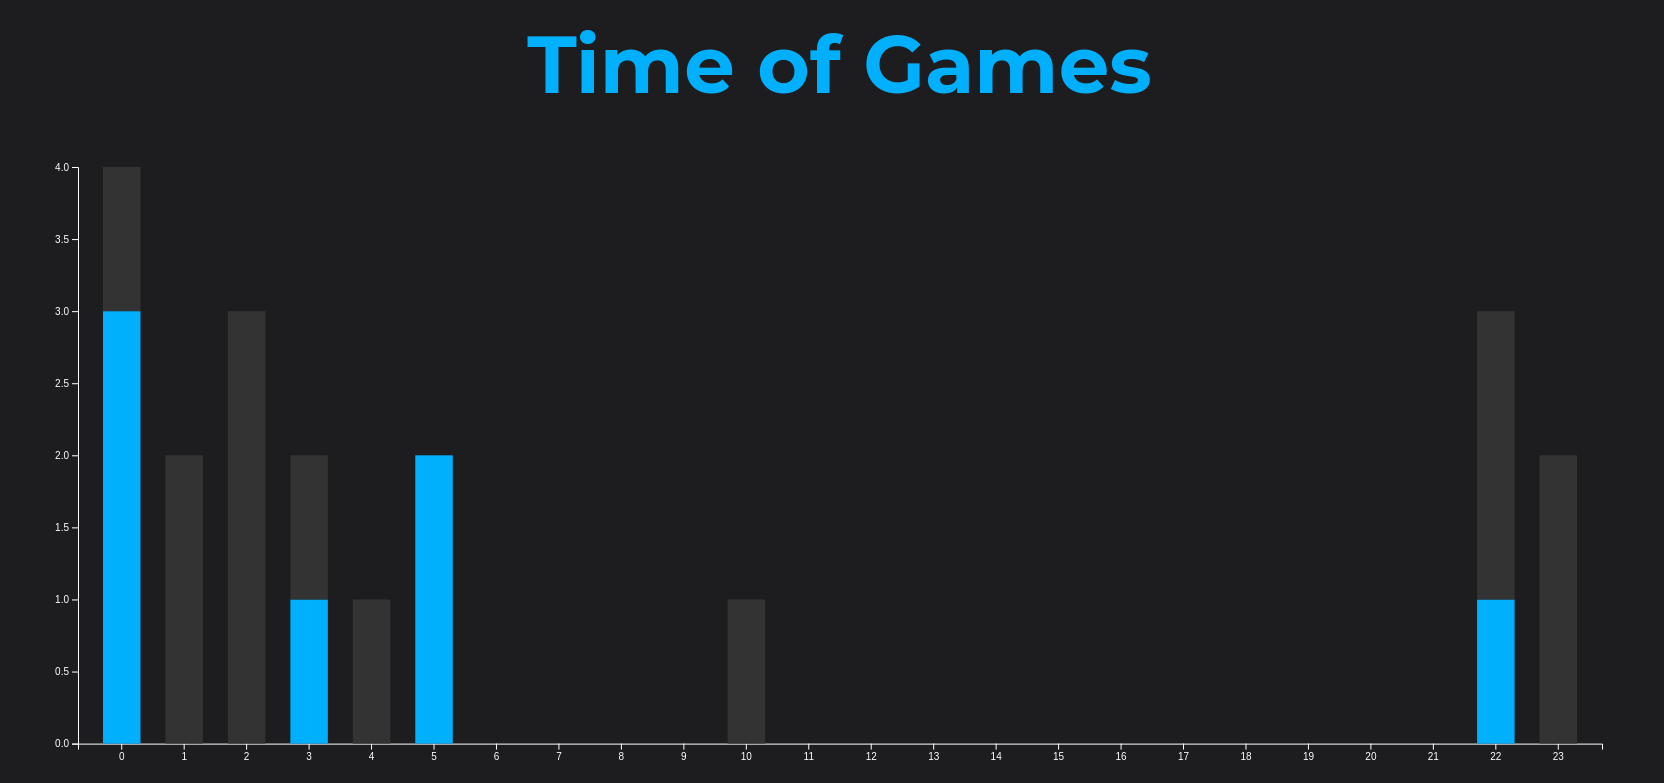
Similar to the original project, a graph of when the player started their games are split into wins and losses, letting players see if there's a particular time of day that may be more successful than another. For example, perhaps a player finds that playing in the morning leads to better win/loss ratios than late at night.
Comparison of Won vs. Lost Games
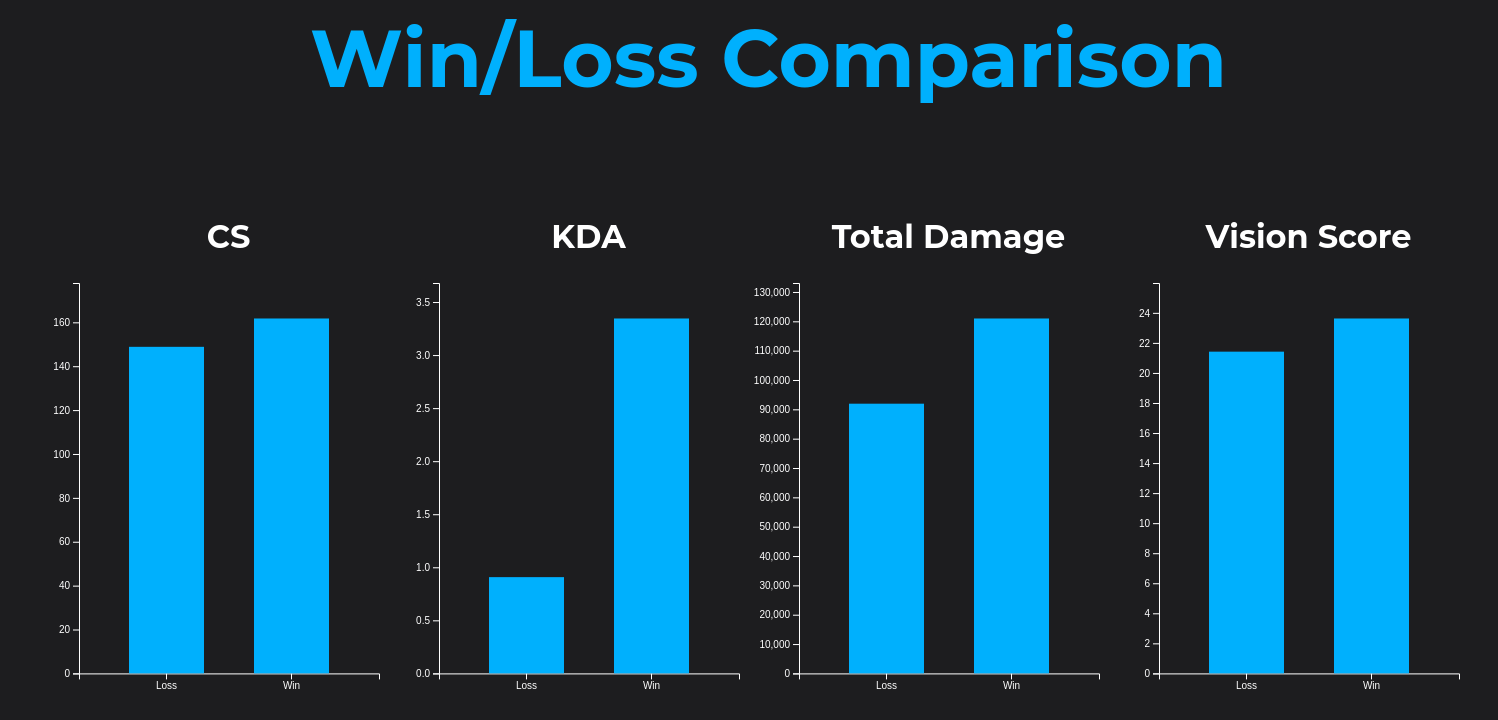
A couple of key statistics are averaged out over all of the games the player has queried for in the landing page, and compared over the games they won and lost. This may lead to analyzing which areas of gameplay a player may be lacking in by looking at correlations between averages in the games they won vs lost.
Trends
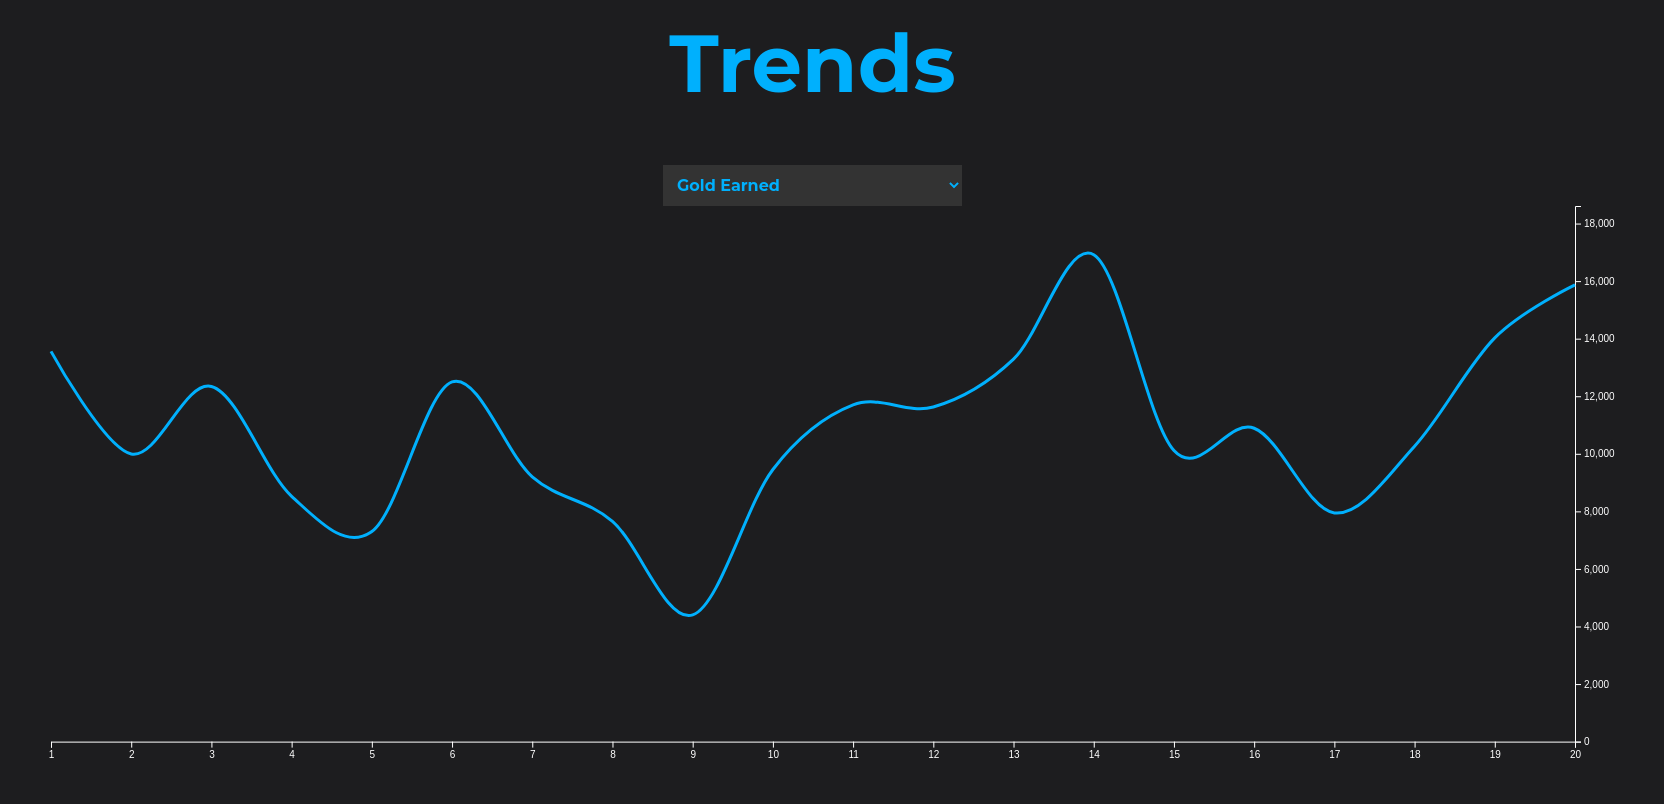
Various variables such as but not limited to Minion Score, Damage Dealt, Kills, etc. are plotted by game number, where game number linearly spaces out the games with the most recent on the right, and the oldest on the left of the x-axis.
