LoL Flowers
Purpose: Personal
Project Type: R, React.js, D3
Date: August, 2020
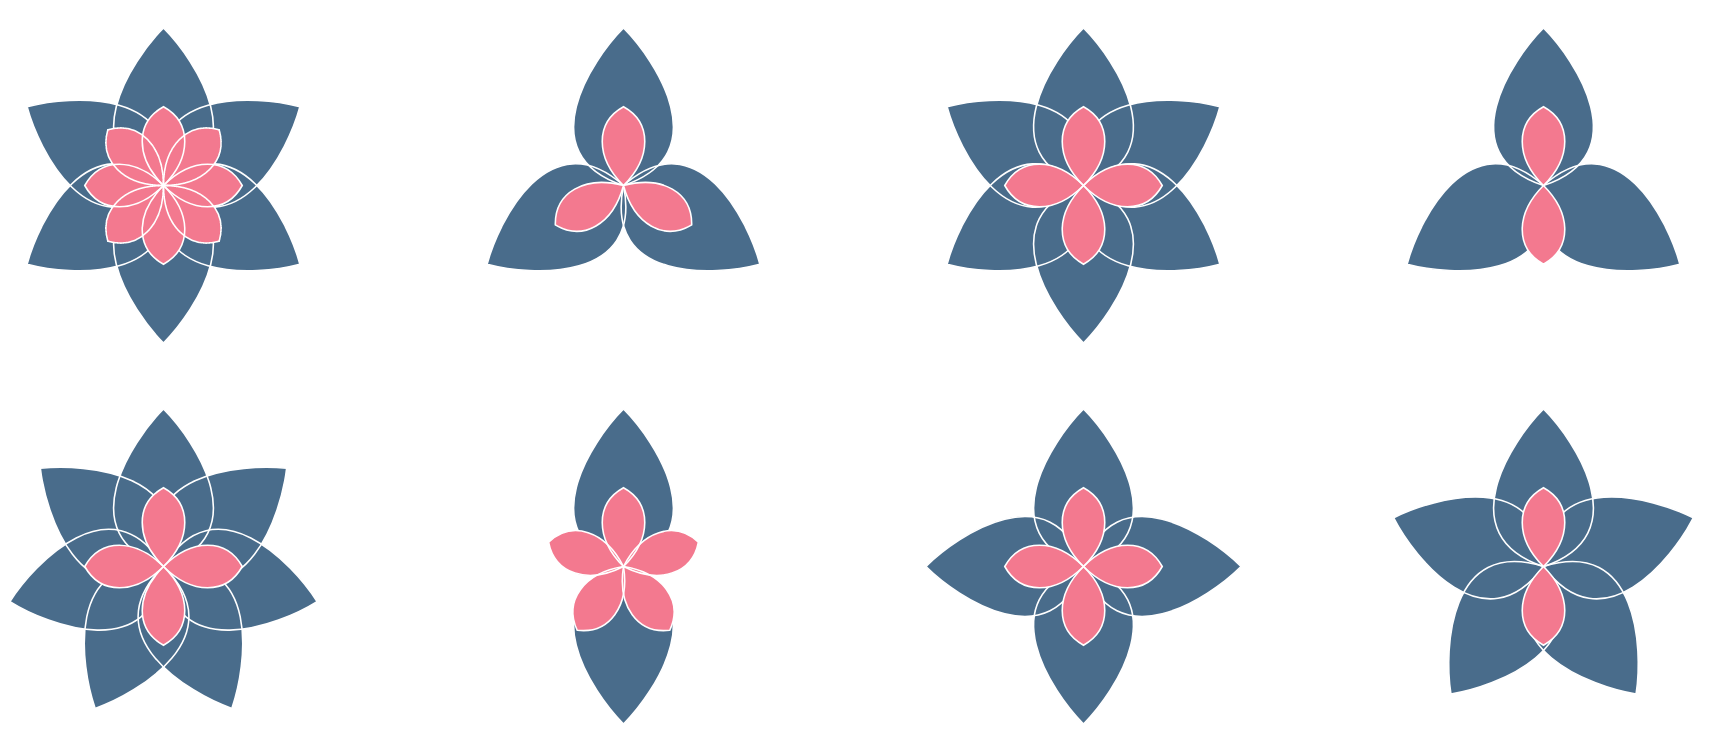
Visualizations of a player's kill/death ratio in their recent League of Legends games. Inspired by Shirley Wu's Film Flowers.
Getting and Cleaning Data
Utilizing q3w3e3's server, an API using Plumber and R was set up to handle the requests to the Riot API for match data and details. All formatting of data is done in R, and then passed into the front-end where D3 then plots the data in the form of the flowers.
For the data needed here, an initial request is made to get a unique ID for the player from their publicly displayed username. Their ID is then used to get a list of their recent match's game IDs. These game ID's are then used to get details of that particular match with one request per game. Each game's details and statistics are filtered for the details of the player only, and added to a DataFrame, which then gets sent to the frontend as a JSON object.
D3 and React

This was the first time utilizing D3 with React together for me, and Shirley Wu's various talks about using them together as well as The Muratorium's YouTube series on using D3 with React Hooks were the starting point of learning integrating these two together.
The player's recent games are split into one flower per game, and currently the most recent 20 played games are used. A player's number of deaths are the number of blue petals, while kills are the number of red petals.
I'll likely use this same process of having R do back-end data analysis then passing it to a React and D3 front end for a larger LoL player stats visualization project in the future similar to what was done a few months prior for INFO 201 at UW, where I built a Shiny app purely in R that visualized various statistics for the player.